| Electrical Communication is a free textbook on the basics of communication technology. See the editorial for more information.... |

|
Home  Electroacoustic Devices Receiver Characteristics with Diaphragm Blocked Electroacoustic Devices Receiver Characteristics with Diaphragm Blocked |
|||||||


|
  |
||||||
Receiver Characteristics with Diaphragm BlockedThe impedance is measured with the diaphragm held stationary in such a way that the normal magnetic field relations will not be changed. That is, the diaphragm is held in the same position as when the receiver coils are not carrying current. Several methods33 have been developed for blocking the diaphragm. One method employs air damping and is accomplished by closing the hole in the receiver cap with an air-tight plug of wood or wax. This last method was used in obtaining the data here included. Resistance and reactance curves obtained with the diaphragm of a telephone receiver blocked are as shown in Fig. 26. The test current for this figure and those that follow was 1.0 milliampere.
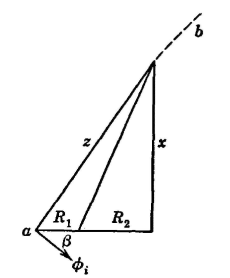
An impedance diagram corresponding to these readings is included in Fig. 27. The line R1 represents the direct-current resistance of the receiver windings. The line R2 represents that part of the total effective resistance due to power consumed largely in hysteresis and eddy-current losses in the magnetic circuit. The line R1 + R2 is the resistance component, the line x the reactive component, and z the impedance of the receiver with the diaphragm blocked. The corresponding vector diagram is given in Fig. 28. The vector Ez represents the voltage across the receiver, leading the receiver current I by an angle α. The vector φi is the flux produced by the current I and lags I by the angle β because of the hysteresis and the skin effect in the magnetic circuit.33
The reactance of Fig. 27 increases almost directly as the frequency. The alternating-current portion R2 of the damped receiver resistance is largely composed of hysteresis and eddy-current losses. Because of these losses the measured effective resistance varies as the frequency to some power greater than unity (page 52), and the point b of Fig. 27 will follow the approximate path a-b which bends continually to the right. This bending tendency is evident in Fig. 29, which represents the intersections of x and z (or the point b of Fig. 27) for a number of frequencies.
|
|||||||
| Home Electroacoustic Devices Receiver Characteristics with Diaphragm Blocked |
|
||||||


Last Update: 2011-05-18