| The ebook Elementary Calculus is based on material originally written by H.J. Keisler. For more information please read the copyright pages. |

|

Home  Trigonometric Functions Trigonometric Functions  Slopes And Curve Sketching in Polar Coordinates Slopes And Curve Sketching in Polar Coordinates  Examples Examples  Example 2: Sketching r = sin 2θ Example 2: Sketching r = sin 2θ |
||||||||||||||||||||||||||||||||||||||||||||||||||||||||


|
||||||||||||||||||||||||||||||||||||||||||||||||||||||||
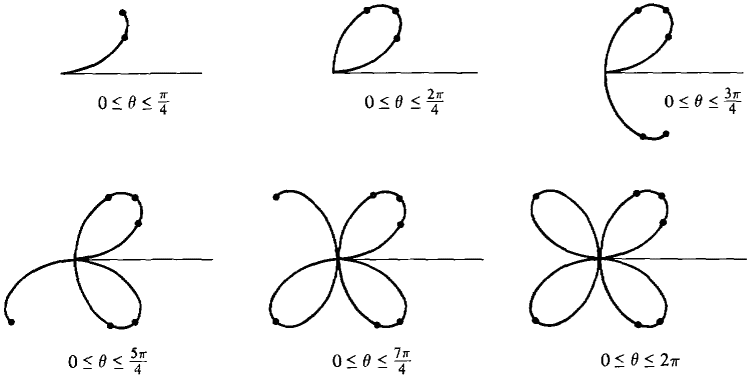
Example 2: Sketching r = sin 2θ
Sketch the curve r = sin 2θ.
If r approaches ∞ as θ approaches 0 or π, the curve may have a horizontal asymptote which can be found by computing the limit of y. At θ = π/2 or 3π/2 there may be vertical asymptotes. The method is illustrated in the following example.
|
||||||||||||||||||||||||||||||||||||||||||||||||||||||||
Home  Trigonometric Functions Trigonometric Functions  Slopes And Curve Sketching in Polar Coordinates Slopes And Curve Sketching in Polar Coordinates  Examples Examples  Example 2: Sketching r = sin 2θ Example 2: Sketching r = sin 2θ |
||||||||||||||||||||||||||||||||||||||||||||||||||||||||
Last Update: 2006-11-15


 , π,
, π,  . dr/dθ = 0 at θ =

 beginning at θ = 0. We can save some time by observing that the values from π to 2π are the same as those from 0 to π.