| Electronic Transformers and Circuits is a free introductory textbook on transformers and related circuits. See the editorial for more information.... |

|

Home  Pulse and Video Transformers Pulse and Video Transformers  Frequency Response and Wave Shape Frequency Response and Wave Shape |
|||||||||||||||||||


|
|||||||||||||||||||
Frequency Response and Wave Shape
Because of the prevalent thinking of engineers in terms of frequency response rather than wave shape, it is sometimes necessary to correlate the two concepts. The matter of phase shift enters, for the reason that the relative phase of the different frequency components affects wave shape. It is sometimes convenient to know whether a transformer, whose frequency response is known, can deliver a given wave shape. Starting with the low-frequency response, assume equal source and load resistances; the upper curve of Fig. 108 (p. 148) applies. This curve shows 90 per cent of maximum response at the frequency for which XN/R1 = 1. How does this frequency compare with the reciprocal of the pulse width at the end of which there is 10 per cent droop in the top of the pulse? XN/R1 can be written
Likewise, from the proper curve of Fig. 234, for 10 per cent droop,
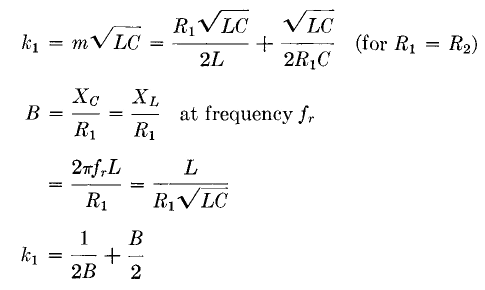
Combining equations 133 and 134 gives f = 0.0318 (1/τ), or the transformer should be not over 1 db down at a frequency about 1/30 of the reciprocal of the pulse width. For example, if a maximum of 10 per cent droop is desired at 2 microseconds the response should be not more than -1 db at 0.0318 · 0.5 · 106 = 16 kc. Maximum phase shift is 27 degrees (from Fig. 131, p. 180), but this is taken into account in Fig. 234. Similarly, front-edge steepness can be related to transformer high-frequency response, which for the case of R1 = R2 is found in Fig. 109. The corresponding front-edge curves are found in Fig. 231. Parameter k1 of these curves is related to B in Fig. 109 as follows.
From equation 135 we can prepare Table XVI.
Table XVI. Parameters for Frequency Response and Wave Shape
Transformer OCL, leakage inductance, and effective capacitance must be known to make this comparison, but these quantities are already known if it is established that the frequency response is given by Figs. 108 and 109, or the wave shape by Figs. 231 and 234. If conditions other than R1 = R2 prevail, another set of response curves can be used, and corresponding approximate relations can be found in the manner here outlined. Pulse transformer windings are similar to those in the high-frequency transformers described in iron-Core Transformers. Resonance frequency fr is determined largely by leakage inductance and winding-to-winding capacitance. With pulse operation, partial resonances of sections of a coil, and even turn-to-turn resonance, may appear because of the steep front edge of voltage impressed on the transformer. If these resonances cause pronounced oscillations in the output wave form, larger coil or turn spacings or fewer turns may be necessary to reduce them.
|
|||||||||||||||||||
Home  Pulse and Video Transformers Pulse and Video Transformers  Frequency Response and Wave Shape Frequency Response and Wave Shape |
|||||||||||||||||||
Last Update: 2011-01-24


