| Lectures on Physics has been derived from Benjamin Crowell's Light and Matter series of free introductory textbooks on physics. See the editorial for more information.... |
|
Home  Newtonian Physics Velocity and Relative Motion Graphs of Motion; Velocity Newtonian Physics Velocity and Relative Motion Graphs of Motion; Velocity |
|||||||||||||||||||||||||||||||||||


|
  |
||||||||||||||||||||||||||||||||||
|
Graphs of Motion; Velocity
Motion with constant velocity
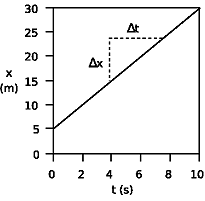
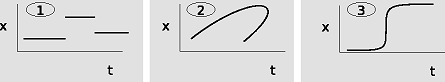
In example m, an object is moving at constant speed in one direction. We can tell this because every two seconds, its position changes by five meters. In algebra notation, we'd say that the graph of x vs. t shows the same change in position, Δx = 5.0 m, over each interval of Δt = 2.0 s. The object's velocity or speed is obtained by calculating v = Δx/Δt = (5.0 m)/(2.0 s) = 2.5 m/s. In graphical terms, the velocity can be interpreted as the slope of the line. Since the graph is a straight line, it wouldn't have mattered if we'd taken a longer time interval and calculated v = Δx/Δt = (10.0 m)/(4.0 s). The answer would still have been the same, 2.5 m/s. Note that when we divide a number that has units of meters by another number that has units of seconds, we get units of meters per second, which can be written m/s. This is another case where we treat units as if they were algebra symbols, even though they're not.
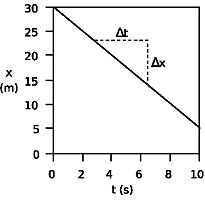
In example n, the object is moving in the opposite direction: as time progresses, its x coordinate decreases. Recalling the definition of the Δ notation as "after minus before," we find that Δt is still positive, but Δx must be negative. The slope of the line is therefore negative, and we say that the object has a negative velocity, v = Δx/Δt = (-5.0 m)/(2.0 s) = -2.5 m/s. We've already seen that the plus and minus signs of Δx values have the interpretation of telling us which direction the object moved. Since Δt is always positive, dividing by Δt doesn't change the plus or minus sign, and the plus and minus signs of velocities are to be interpreted in the same way. In graphical terms, a positive slope characterizes a line that goes up as we go to the right, and a negative slope tells us that the line went down as we went to the right. → Solved problem: light-years page 94, problem 4
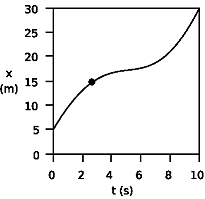
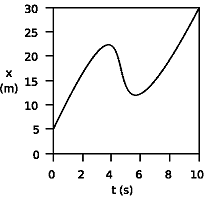
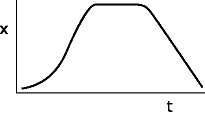
Motion with changing velocityNow what about a graph like figure o? This might be a graph of a car's motion as the driver cruises down the freeway, then slows down to look at a car crash by the side of the road, and then speeds up again, disappointed that there is nothing dramatic going on such as flames or babies trapped in their car seats. (Note that we are still talking about one-dimensional motion. Just because the graph is curvy doesn't mean that the car's path is curvy. The graph is not like a map, and the horizontal direction of the graph represents the passing of time, not distance.)
Example o is similar to example m in that the object moves a total of 25.0 m in a period of 10.0 s, but it is no longer true that it makes the same amount of progress every second. There is no way to characterize the entire graph by a certain velocity or slope, because the velocity is different at every moment. It would be incorrect to say that because the car covered 25.0 m in 10.0 s, its velocity was 2.5 m/s. It moved faster than that at the beginning and end, but slower in the middle. There may have been certain instants at which the car was indeed going 2.5 m/s, but the speedometer swept past that value without "sticking," just as it swung through various other values of speed. (I definitely want my next car to have a speedometer calibrated in m/s and showing both negative and positive values.)
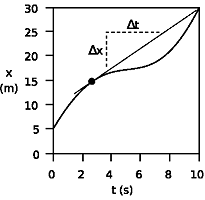
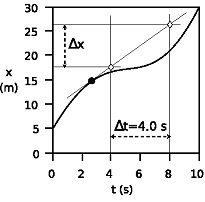
We assume that our speedometer tells us what is happening to the speed of our car at every instant, but how can we define speed mathematically in a case like this? We can't just define it as the slope of the curvy graph, because a curve doesn't have a single well-defined slope as does a line. A mathematical definition that corresponded to the speedometer reading would have to be one that attached a different velocity value to a single point on the curve, i.e., a single instant in time, rather than to the entire graph. If we wish to define the speed at one instant such as the one marked with a dot, the best way to proceed is illustrated in p, where we have drawn the line through that point called the tangent line, the line that "hugs the curve." We can then adopt the following definition of velocity: One interpretation of this definition is that the velocity tells us how many meters the object would have traveled in one second, if it had continued moving at the same speed for at least one second. To some people the graphical nature of this definition seems "inaccurate" or "not mathematical." The equation by itself, however, is only valid if the velocity is constant, and so cannot serve as a general definition.
Conventions about graphingThe placement of t on the horizontal axis and x on the upright axis may seem like an arbitrary convention, or may even have disturbed you, since your algebra teacher always told you that x goes on the horizontal axis and y goes on the upright axis. There is a reason for doing it this way, however. In example q, we have an object that reverses its direction of motion twice. It can only be in one place at any given time, but there can be more than one time when it is at a given place. For instance, this object passed through x = 17 m on three separate occasions, but there is no way it could have been in more than one place at t = 5.0 s. Resurrecting some terminology you learned in your trigonometry course, we say that x is a function of t, but t is not a function of x. In situations such as this, there is a useful convention that the graph should be oriented so that any vertical line passes through the curve at only one point. Putting the x axis across the page and t upright would have violated this convention. To people who are used to interpreting graphs, a graph that violates this convention is as annoying as fingernails scratching on a chalkboard. We say that this is a graph of "x versus t." If the axes were the other way around, it would be a graph of "t versus x." I remember the "versus" terminology by visualizing the labels on the x and t axes and remembering that when you read, you go from left to right and from top to bottom. Discussion Questions
|
|||||||||||||||||||||||||||||||||||
| Home Newtonian Physics Velocity and Relative Motion Graphs of Motion; Velocity |
|
||||||||||||||||||||||||||||||||||