| Lectures on Physics has been derived from Benjamin Crowell's Light and Matter series of free introductory textbooks on physics. See the editorial for more information.... |
|
Home  Newtonian Physics Velocity and Relative Motion Graphs of Velocity Versus Time Newtonian Physics Velocity and Relative Motion Graphs of Velocity Versus Time |
|||


|
  |
||
|
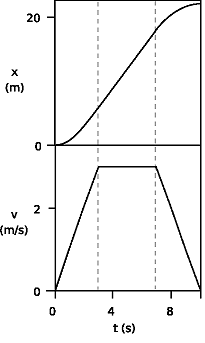
Graphs of Velocity Versus TimeSince changes in velocity play such a prominent role in physics, we need a better way to look at changes in velocity than by laboriously drawing tangent lines on x-versus-t graphs. A good method is to draw a graph of velocity versus time. The examples on the left show the x-t and v-t graphs that might be produced by a car starting from a traffic light, speeding up, cruising for a while at constant speed, and finally slowing down for a stop sign. If you have an air freshener hanging from your rear-view mirror, then you will see an effect on the air freshener during the beginning and ending periods when the velocity is changing, but it will not be tilted during the period of constant velocity represented by the flat plateau in the middle of the v-t graph.
Students often mix up the things being represented on these two types of graphs. For instance, many students looking at the top graph say that the car is speeding up the whole time, since "the graph is becoming greater." What is getting greater throughout the graph is x, not v. Similarly, many students would look at the bottom graph and think it showed the car backing up, because "it's going backwards at the end." But what is decreasing at the end is v, not x. Having both the x-t and v-t graphs in front of you like this is often convenient, because one graph may be easier to interpret than the other for a particular purpose. Stacking them like this means that corresponding points on the two graphs' time axes are lined up with each other vertically. However, one thing that is a little counterintuitive about the arrangement is that in a situation like this one involving a car, one is tempted to visualize the landscape stretching along the horizontal axis of one of the graphs. The horizontal axes, however, represent time, not position. The correct way to visualize the landscape is by mentally rotating the horizon 90 degrees counterclockwise and imagining it stretching along the upright axis of the x-t graph, which is the only axis that represents different positions in space.
|
|||
| Home Newtonian Physics Velocity and Relative Motion Graphs of Velocity Versus Time |
|
||