| Lectures on Physics has been derived from Benjamin Crowell's Light and Matter series of free introductory textbooks on physics. See the editorial for more information.... |
|
Home  Newtonian Physics Acceleration and Free Fall Varying Acceleration Newtonian Physics Acceleration and Free Fall Varying Acceleration |
||||||||||||||||||


|
  |
|||||||||||||||||
|
Varying AccelerationSo far we have only been discussing examples of motion for which the v-t graph is linear. If we wish to generalize our definition to v-t graphs that are more complex curves, the best way to proceed is similar to how we defined velocity for curved x-t graphs:
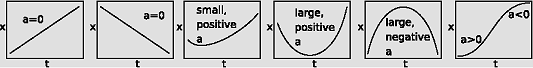
In the skydiver example, the x-t graph was not even used in the solution of the problem, since the definition of acceleration refers to the slope of the v-t graph. It is possible, however, to interpret an x-t graph to find out something about the acceleration. An object with zero acceleration, i.e., constant velocity, has an x-t graph that is a straight line. A straight line has no curvature. A change in velocity requires a change in the slope of the x-t graph, which means that it is a curve rather than a line. Thus acceleration relates to the curvature of the x-t graph. Figure m shows some examples. In the example 6, the x-t graph was more strongly curved at the beginning, and became nearly straight at the end. If the x-t graph is nearly straight, then its slope, the velocity, is nearly constant, and the acceleration is therefore small. We can thus interpret the acceleration as representing the curvature of the x-t graph, as shown in figure m. If the "cup" of the curve points up, the acceleration is positive, and if it points down, the acceleration is negative.
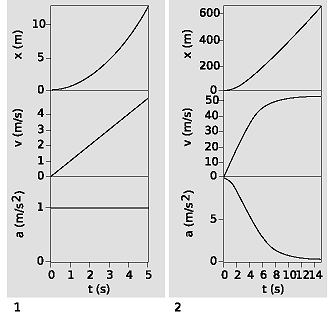
Since the relationship between a and v is analogous to the relationship between v and x, we can also make graphs of acceleration as a function of time, as shown in figure n.
→ Solved problem: Drawing a v-t graph. page 125, problem 14 → Solved problem: Drawing v-t and a-t graphs. page 126, problem 20
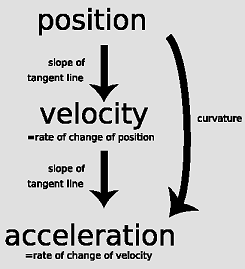
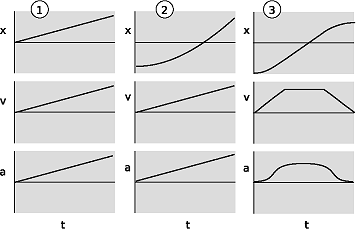
Figure o summarizes the relationships among the three types of graphs. Discussion Questions
|
||||||||||||||||||
| Home Newtonian Physics Acceleration and Free Fall Varying Acceleration |
|
|||||||||||||||||