| Lectures on Physics has been derived from Benjamin Crowell's Light and Matter series of free introductory textbooks on physics. See the editorial for more information.... |
|
Home  Electricity Fields of Force Two or Three Dimensions Electricity Fields of Force Two or Three Dimensions |
|||||||||||


|
  |
||||||||||
|
Two or Three Dimensions
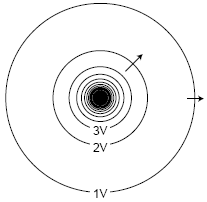
The topographical map shown in figure (a) suggests a good way to visualize the relationship between field and voltage in two dimensions. Each contour on the map is a line of constant height; some of these are labeled with their elevations in units of feet. Height is related to gravitational potential energy, so in a gravitational analogy, we can think of height as representing voltage. Where the contour lines are far apart, as in the town, the slope is gentle. Lines close together indicate a steep slope. If we walk along a straight line, say straight east from the town, then height (voltage) is a function of the east-west coordinate x. Using the usual mathematical definition of the slope, and writing V for the height in order to remind us of the electrical analogy, the slope along such a line is ΔV/Δx, or dV/dx if the slope isn't constant. What if everything isn't confined to a straight line? Water flows down hill. Notice how the streams on the map cut perpendicularly through the lines of constant height.
1V 2V 3V It is possible to map voltages in the same way, as shown in figure (b). The electric field is strongest where the constant-voltage curves are closest together, and the electric field vectors always point perpendicular to the constant-voltage curves. The figures on the following page show some examples of ways to visualize field and voltage patterns. Mathematically, the calculus of the preceding section generalizes to three dimensions as follows: E x = -dV/dx E y = -dV/dy E z = -dV/dz
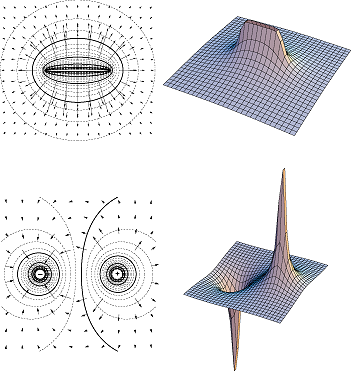
Top: A uniformly charged rod. Bottom: A dipole. In each case, the diagram on the left shows the field vectors and constant-voltage curves, while the one on the right shows the voltage (up-down coordinate) as a function of x and y. Interpreting the field diagrams: Each arrow represents the field at the point where its tail has been positioned. For clarity, some of the arrows in regions of very strong field strength are not shown - they would be too long to show. Interpreting the constant-voltage curves: In regions of very strong fields, the curves are not shown because they would merge together to make solid black regions. Interpreting the perspective plots: Keep in mind that even though we're visualizing things in three dimensions, these are really two-dimensional voltage patterns being represented. The third (up-down) dimension represents voltage, not position.
|
|||||||||||
| Home Electricity Fields of Force Two or Three Dimensions |
|
||||||||||