| Lectures on Physics has been derived from Benjamin Crowell's Light and Matter series of free introductory textbooks on physics. See the editorial for more information.... |
|
Home  Optics Exercises Single-slit diffraction Optics Exercises Single-slit diffraction |
||


|
  |
|
|
Single-slit diffractionEquipment:
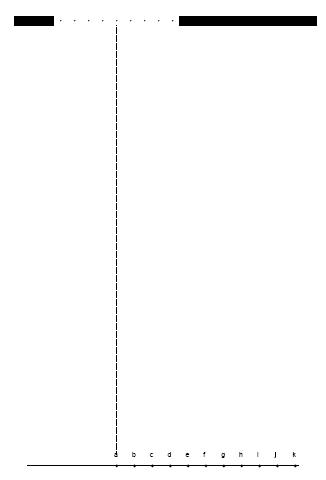
The following page is a diagram of a single slit and a screen onto which its diffraction pattern is projected. The class will make a numerical prediction of the intensity of the pattern at the different points on the screen. Each group will be responsible for calculating the intensity at one of the points. (Either 11 groups or six will work nicely -- in the latter case, only points a, c, e, g, i, and k are used.) The idea is to break up the wavefront in the mouth of the slit into nine parts, each of which is assumed to radiate semicircular ripples as in Huygens' principle. The wavelength of the wave is 1 cm, and we assume for simplicity that each set of ripples has an amplitude of 1 unit when it reaches the screen. 1. For simplicity, let's imagine that we were only to use two sets of ripples rather than nine. You could measure the distance from each of the two points inside the slit to your point on the screen. Suppose the distances were both 25.0 cm. What would be the amplitude of the superimposed waves at this point on the screen? Suppose one distance was 24.0 cm and the other was 25.0 cm. What would happen? What if one was 24.0 cm and the other was 26.0 cm? What if one was 24.5 cm and the other was 25.0 cm? In general, what combinations of distances will lead to completely destructive and completely constructive interference? Can you estimate the answer in the case where the distances are 24.7 and 25.0 cm? 2. Although it is possible to calculate mathematically the amplitude of the sine wave that results from superimposing two sine waves with an arbitrary phase difference between them, the algebra is rather laborious, and it become even more tedious when we have more than two waves to superimpose. Instead, one can simply use a computer spreadsheet or some other computer program to add up the sine waves numerically at a series of points covering one complete cycle. This is what we will actually do. You just need to enter the relevant data into the computer, then examine the results and pick off the amplitude from the resulting list of numbers. 3. Measure all nine distances to your group's point on the screen, and write them on the board - that way everyone can see everyone else's data, and the class can try to make sense of why the results came out the way they did. Determine the amplitude of the combined wave, and write it on the board as well. 4. Why do you think the intensity at the center came out the way it did? Would it have mattered if we had used 900 sets of ripples rather than 9? 5. Looking at the raw data for the point that had the least intensity, can you see why it came out that way? 6. What do you notice about the width of the central maximum compared to the width of the first side maximum? How is this different from double-slit interference? Compare with figure (b) in section 5.7. 7. Although the pattern goes up and down, the general trend is that the farther away we get from the center, the weaker it gets. Why does it make sense that the intensity at some random angle far from the center would tend to be small? 8. Single-slit diffraction can actually be calculated using equations in closed form rather than doing it numerically, and one result is that the intensity of the second maximum is always smaller than the intensity of the central maximum by a factor of 4/9π2. Note that the intensity (in units of watts per unit area) is proportional to the square of the wave's amplitude. Compare our results with the exact result.
|
||
| Home Optics Exercises Single-slit diffraction |
|
|