| Lectures on Physics has been derived from Benjamin Crowell's Light and Matter series of free introductory textbooks on physics. See the editorial for more information.... |
|
Home  Modern Physics Light as a Particle How Much Light Is One Photon? Modern Physics Light as a Particle How Much Light Is One Photon? |
|||||||||||||||||||||||||||||


|
  |
||||||||||||||||||||||||||||
|
The photoelectric effect
The photoelectric effectWe have seen evidence that light energy comes in little chunks, so the next question to be asked is naturally how much energy is in one chunk. The most straightforward experimental avenue for addressing this question is a phenomenon known as the photoelectric effect. The photoelectric effect occurs when a photon strikes the surface of a solid object and knocks out an electron. It occurs continually all around you. It is happening right now at the surface of your skin and on the paper or computer screen from which you are reading these words. It does not ordinarily lead to any observable electrical effect, however, because on the average, free electrons are wandering back in just as frequently as they are being ejected. (If an object did somehow lose a significant number of electrons, its growing net positive charge would begin attracting the electrons back more and more strongly.)
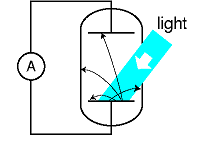
Figure e shows a practical method for detecting the photoelectric effect. Two very clean parallel metal plates (the electrodes of a capacitor) are sealed inside a vacuum tube, and only one plate is exposed to light. Because there is a good vacuum between the plates, any ejected electron that happens to be headed in the right direction will almost certainly reach the other capacitor plate without colliding with any air molecules. The illuminated (bottom) plate is left with a net positive charge, and the unilluminated (top) plate acquires a negative charge from the electrons deposited on it. There is thus an electric field between the plates, and it is because of this field that the electrons' paths are curved, as shown in the diagram. However, since vacuum is a good insulator, any electrons that reach the top plate are prevented from responding to the electrical attraction by jumping back across the gap. Instead they are forced to make their way around the circuit, passing through an ammeter. The ammeter measures the strength of the photoelectric effect.
An unexpected dependence on frequencyThe photoelectric effect was discovered serendipitously by Heinrich Hertz in 1887, as he was experimenting with radio waves. He was not particularly interested in the phenomenon, but he did notice that the effect was produced strongly by ultraviolet light and more weakly by lower frequencies. Light whose frequency was lower than a certain critical value did not eject any electrons at all.1 This dependence on frequency didn't make any sense in terms of the classical wave theory of light. A light wave consists of electric and magnetic fields. The stronger the fields, i.e., the greater the wave's amplitude, the greater the forces that would be exerted on electrons that found themselves bathed in the light. It should have been amplitude (brightness) that was relevant, not frequency. The dependence on frequency not only proves that the wave model of light needs modifying, but with the proper interpretation it allows us to determine how much energy is in one photon, and it also leads to a connection between the wave and particle models that we need in order to reconcile them. To make any progress, we need to consider the physical process by which a photon would eject an electron from the metal electrode. A metal contains electrons that are free to move around. Ordinarily, in the interior of the metal, such an electron feels attractive forces from atoms in every direction around it. The forces cancel out. But if the electron happens to find itself at the surface of the metal, the attraction from the interior side is not balanced out by any attraction from outside. Bringing the electron out through the surface therefore requires a certain amount of work, W, which depends on the type of metal used. Suppose a photon strikes an electron, annihilating itself and giving up all its energy to the electron.2 The electron will (1) lose kinetic energy through collisions with other electrons as it plows through the metal on its way to the surface; (2) lose an amount of kinetic energy equal to W as it emerges through the surface; and (3) lose more energy on its way across the gap between the plates, due to the electric field between the plates. Even if the electron happens to be right at the surface of the metal when it absorbs the photon, and even if the electric field between the plates has not yet built up very much, W is the bare minimum amount of energy that the electron must receive from the photon if it is to contribute to a measurable current. The reason for using very clean electrodes is to minimize W and make it have a definite value characteristic of the metal surface, not a mixture of values due to the various types of dirt and crud that are present in tiny amounts on all surfaces in everyday life. We can now interpret the frequency dependence of the photoelectric effect in a simple way: apparently the amount of energy possessed by a photon is related to its frequency. A low-frequency red or infrared photon has an energy less than W, so a beam of them will not produce any current. A high-frequency blue or violet photon, on the other hand, packs enough of a punch to allow an electron to get out of the electrode. At frequencies higher than the minimum, the photoelectric current continues to increase with the frequency of the light because of effects (1) and (3).
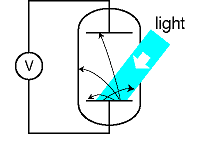
Numerical relationship between energy and frequencyPrompted by Einstein's photon paper, Robert Millikan (whom we encountered in book 4 of this series) figured out how to use the photoelectric effect to probe precisely the link between frequency and photon energy. Rather than going into the historical details of Millikan's actual experiments (a lengthy experimental program that occupied a large part of his professional career) we will describe a simple version, shown in figure f, that is used sometimes in college laboratory courses. The idea is simply to illuminate one plate of the vacuum tube with light of a single wavelength and monitor the voltage difference between the two plates as they charge up. Since the resistance of a voltmeter is very high (much higher than the resistance of an ammeter), we can assume to a good approximation that electrons reaching the top plate are stuck there permanently, so the voltage will keep on increasing for as long as electrons are making it across the vacuum tube.
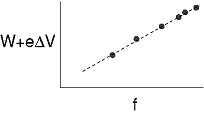
At a moment when the voltage difference has a reached a value ΔV, the minimum energy required by an electron to make it out of the bottom plate and across the gap to the other plate is W +eΔV. As ΔV increases, we eventually reach a point at which W + eΔV equals the energy of one photon. No more electrons can cross the gap, and the reading on the voltmeter stops rising. The quantity W+eΔV now tells us the energy of one photon. If we determine this energy for a variety of frequencies, g, we find the following simple relationship between the energy of a photon and the frequency of the light: E = hf , where h is a constant with a numerical value of 6.63 × 10⁻³⁴ J·s. Note how the equation brings the wave and particle models of light under the same roof: the left side is the energy of one particle of light, while the right side is the frequency of the same light, interpreted as a wave. The constant h is known as Planck's constant (see historical note below).
Since the energy of a photon is hf, a beam of light can only have energies of hf, 2hf, 3hf, etc. Its energy is quantized - there is no such thing as a fraction of a photon. Quantum physics gets its name from the fact that it quantizes things like energy, momentum, and angular momentum that had previously been thought to be smooth, continuous and infinitely divisible.
What I'm presenting in this chapter is a simplified explanation of how
the photon could have been discovered. The actual history is more
complex. Max Planck (1858-1947) began the photon saga with a theoretical
investigation of the spectrum of light emitted by a hot, glowing
object. He introduced quantization of the energy of light waves, in multiples
of hf , purely as a mathematical trick that happened to produce the
right results. Planck did not believe that his procedure could have any
physical significance. In his 1905 paper Einstein took Planck's quantization
as a description of reality, and applied it to various theoretical and
experimental puzzles, including the photoelectric effect. Millikan then
subjected Einstein's ideas to a series of rigorous experimental tests. Although
his results matched Einstein's predictions perfectly, Millikan was
skeptical about photons, and his papers conspicuously omit any reference
to them. Only in his autobiography did Millikan rewrite history and
claim that he had given experimental proof for photons.
Discussion Questions
|
|||||||||||||||||||||||||||||
| Home Modern Physics Light as a Particle How Much Light Is One Photon? |
|
||||||||||||||||||||||||||||