| Radio Antenna Engineering is a free introductory textbook on radio antennas and their applications. See the editorial for more information.... |
|
Home  High-frequency Antennas High-frequency Propagation Ionosphere Data High-frequency Antennas High-frequency Propagation Ionosphere Data |
|||


|
  |
||
|
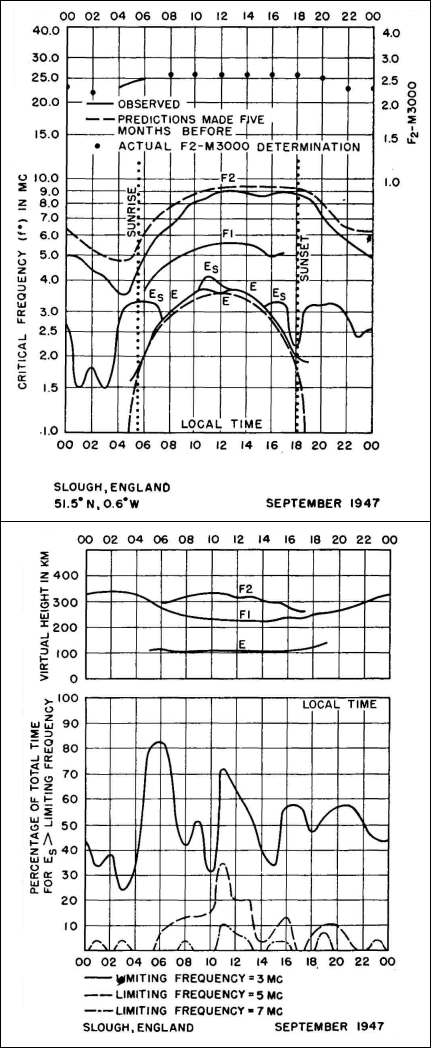
Ionosphere DataAuthor: Edmund A. Laport Figure 3.1 is an example of how measured ionosphere data are presented. The curves in the upper diagram show the critical frequencies for the various layers compared with predictions made 5 months in advance. Below are shown the measured virtual heights.
At the bottom is a chart showing the percentages of total time that the critical frequency for E sporadic regions exceeded 3, 5, and 7 megacycles during this particular month of observations. These figures are median values compiled for a month of observations. They should be regarded not as typical but merely as isolated examples because of the variability of conditions. This particular example was chosen because it shows clearly defined E, F1, and F2 layers during the daylight, a condition that does not always exist. The figure was reproduced from the CRPL-F publication (
Figures 3.2 and 3.3 are sample charts showing critical frequencies for vertical incidence (F2 zero) and for a 4,000-kilometer hop (F2 4,000) for the F layer in the western geomagnetic zone (which includes all of South America and almost all of North America) as they were predicted for January, 1941. Figures 3.4 and 3.5 are samples of the same sort for E and E sporadic layers for the same zone and the same month. These are reproduced from the CRPL-D26 publication of October, 1946, and are the type of data now available for computing the frequencies for high-frequency transmission ( The maximum usable frequency over a given path also varies with sun-spot activity. There is no simple relationship for this effect, because in addition to the dominant 11-year sunspot cycle, there are others - including a prominent one of approximately 83 years. When these two major cycles coincide at their maximums (1947) or at their minimums (1900), there exist the greatest extremes in sunspot numbers, with corresponding effect on the maximum usable frequency for any path. During the 11-year cycle ending with its maximum in 1943 the maximum-usable-frequency range over the 11 years was 2 to 1, with greatest maximum usable frequency coinciding with maximum sunspot activity.
|
|||
| Home High-frequency Antennas High-frequency Propagation Ionosphere Data |
|
||

Last Update: 2011-03-19