| Electrical Communication is a free textbook on the basics of communication technology. See the editorial for more information.... |

|

Home  Fundamentals of Acoustics Fundamentals of Acoustics  The Loudness of Sounds The Loudness of Sounds |
|||||


|
|||||
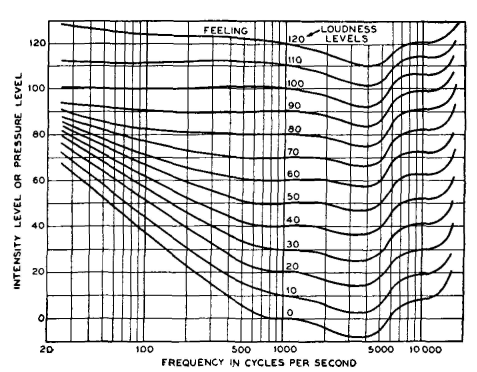
The Loudness of SoundsThe magnitude of the sensation produced in the brain is termed the loudness of a sound,21 Although the loudness of a sound is related to the intensity, the two are not the same. A sound that is loud for one person may not be loud for another. Also, two different sounds which produce equal intensities at the ear may not sound equally loud to the observer. These phenomena are illustrated by the loudness-level contours of Fig. 17. Experiments have shown that loudness depends on both the intensity and the frequency of the sound; that is, the hearing mechanism is not equally sensitive to all intensities and to all frequencies. Loudness is the magnitude of the sensation produced in the brain. It is subjective, depending on the judgment of the individual. The loud-ness level of a sound, rather than the loudness, is accordingly measured. Before further study of Fig. 17 and the method of obtaining these curves, it is advisable to present several definitions largely summarized from reference 29.
Sound Intensity. The sound intensity of a sound field in a specified direction at a point is the sound energy transmitted per unit of time in the specified direction through a unit area normal to the direction at the point. The units for intensity commonly used are the erg per second per square centimeter or the watt per square centimeter. Reference Intensity. The reference intensity for intensity-level comparisons shall be 10-16 watt per square centimeter. Reference Tone. A plane or spherical sound wave having only a single frequency of 1000 cycles per second shall be used. Intensity Level. The intensity level of a sound is the number of decibels above the reference level. Loudness Level. The loudness level of any sound shall be the intensity level of the equally loud reference tone at the position where the listener's ear is to be placed. Thus, in Fig. 17 the loudness levels of the various pure tones (rather than the loudness) are shown. For obtaining these data, observers, using special apparatus,30 compared the sound to be measured with a 1000-cycle reference tone and adjusted the intensity level (in decibels above the chosen zero level of 10-16 watt per square centimeter) of the reference tone until the two sounds were heard as equally loud. Then, the intensity level of the reference tone above the reference intensity is a measure of the loudness level of the tone under test. The curves of Fig. 17 are the characteristic curves of the human ear, showing its sensitiveness to sounds of different intensities and frequencies. Thus, at 100 cycles, a sound must be about 36 db above the reference intensity value at 1000 cycles to be just audible, but, at 10000 cycles, it need be only about 8 db above the reference value to be audible. Studies of the ear21,31 have shown that the increments of either energy or frequency that are necessary for the perception of differences in either loudness or pitch are logarithmic. The ear approximately follows the Weber-Fechner law of psychology, that sense perception varies as the logarithm of the stimulus. If the intensity level of the sound is changed 1 db, it will be found that this is about the smallest change that can be detected by the ear. The fact that equal perceptible changes in frequency are logarithmic is illustrated by the musical scale. The octaves are sensed as equal changes, although, from the frequency standpoint, the note of one octave is twice the frequency of the corresponding note of the next lower octave, and four times the frequency of the corresponding note two octaves lower.
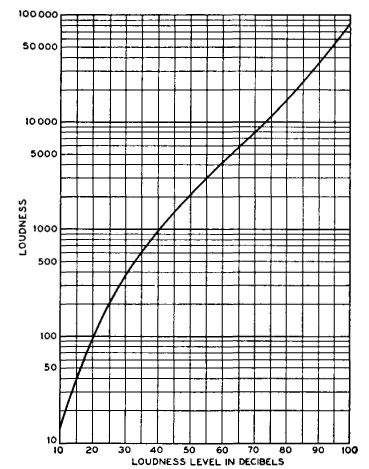
The actual relation between loudness and loudness level is given by Fig. 18. This shows that the ear is not exactly logarithmic; if it were, the curve would be a straight line.30, 32
|
|||||
Home  Fundamentals of Acoustics Fundamentals of Acoustics  The Loudness of Sounds The Loudness of Sounds |
|||||
Last Update: 2011-05-30


