| The ebook Elementary Calculus is based on material originally written by H.J. Keisler. For more information please read the copyright pages. |
|
Home  Continuous Functions Derivatives and Curve Sketching Curve Sketching: Overview Continuous Functions Derivatives and Curve Sketching Curve Sketching: Overview |
|


|
  |
Curve Sketching: Overview
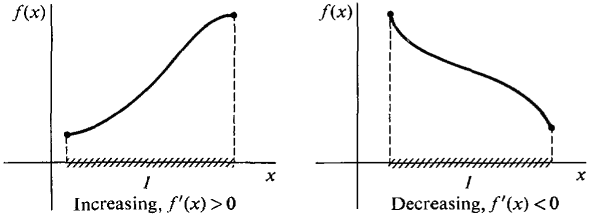
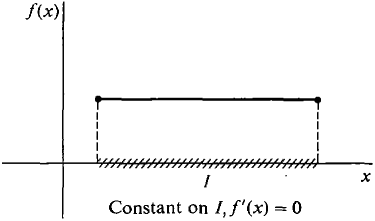
If we compute n values of f(x), f(x1), f(x2), ... ,f(xn), we obtain n points through which the curve y = f(x) passes. The first and second derivatives tell us something about the shape of the curve in the intervals between these points and permit a much more accurate plot of the curve. It is especially helpful to know the signs of the first two derivatives. When the first derivative is positive the curve is increasing from left to right, and when the first derivative is negative the curve is decreasing from left to right. When the first derivative is zero the curve is horizontal. These facts can be proved as a theorem if we define exactly what is meant by increasing and decreasing (see Figures 3.7.1 and 3.7.2).
Figure 3.7.1
Figure 3.7.2
|
|
| Home Continuous Functions Derivatives and Curve Sketching Curve Sketching: Overview |
|
Last Update: 2006-11-25