| The ebook Elementary Calculus is based on material originally written by H.J. Keisler. For more information please read the copyright pages. |

|

Home  Partial Differentiation Partial Differentiation  Surfaces Surfaces  Function f of Two Variables Function f of Two Variables |
|


|
|
Function f of Two Variables
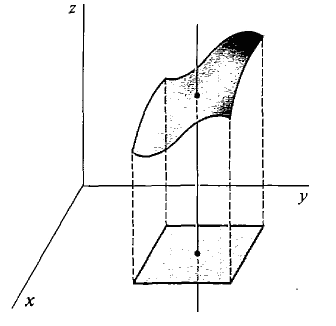
By the graph of a function f of two variables we mean the graph of the equation z = f(x, y). Recall that a real function of two variables is a set of ordered triples (x, y, z) such that for each (x, y) there is at most one z with z = f(x,y). Geometrically this means that the graph of a function intersects each vertical line through (x, y) in at most one point (x, y, z). The value of z is the height of the surface above (x, y). Figure 11.1.3 shows part of a surface z = f(x, y).
Figure 11.1.3 Whenever one quantity depends on two others we have a function of two variables. The height of a surface above (x, y) is one example. A few other examples are: the density of a plane object at (x, y), the area of a rectangle of length x and width y, the size of a wheat crop in a season with rainfall r and average temperature t, the number of items which can be sold if the price is p and the advertising budget is a, and the force of the sun's gravity on an object of mass m at distance d. A rough sketch of the graph can be very helpful in understanding a function of two variables or an equation in three variables. In this section we do two things. First we describe a class of surfaces whose equations are simple and easily recognized, the quadric surfaces. After that we shall give a general method for sketching the graph of an equation. Graph paper with lines in the x, y, and z directions is available in many bookstores. The graph of a second degree equation in x, y, and z is called a quadric surface. These surfaces correspond to the conic sections in the plane. There are several types of quadric surfaces. We shall present each of them in its simplest form.
|
|
Home  Partial Differentiation Partial Differentiation  Surfaces Surfaces  Function f of Two Variables Function f of Two Variables |
|
Last Update: 2006-11-17


