| The ebook FEEE - Fundamentals of Electrical Engineering and Electronics is based on material originally written by T.R. Kuphaldt and various co-authors. For more information please read the copyright pages. |

|
Home  Semiconductors Operational Amplifiers Input to Output Phase Shift Semiconductors Operational Amplifiers Input to Output Phase Shift |
|


|
  |
|
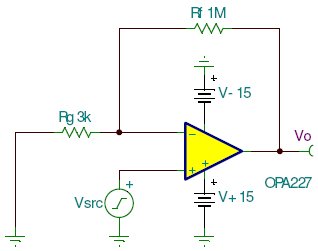
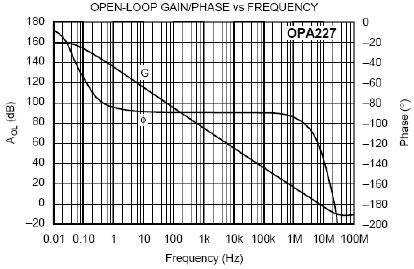
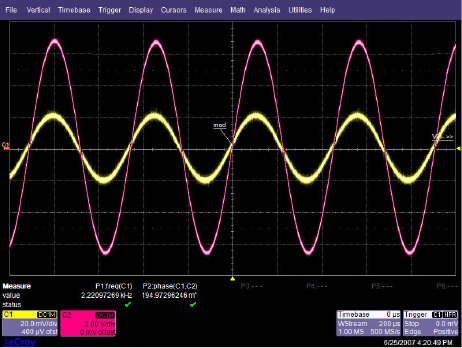
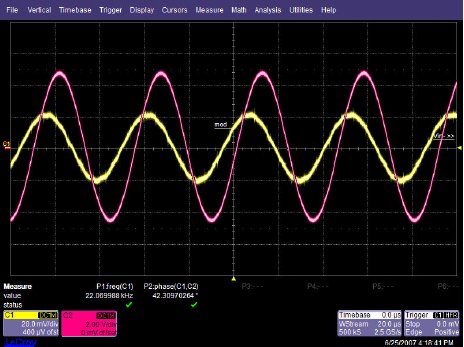
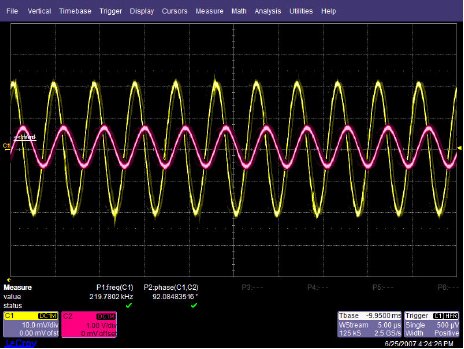
Input to Output Phase ShiftIn order to illustrate the phase shift from input to output of an operational amplifier (op-amp), the OPA227 was tested in our lab. The OPA227 was constructed in a typical non-inverting configuration (Figure below). OPA227 Non-inverting stage The circuit configuration calls for a signal gain of ≅34 V/V or ≅50 dB. The input excitation at Vsrc was set to 10 mVp, and three frequencies of interest: 2.2 kHz, 22 kHz, and 220 MHz. The OPA227's open loop gain and phase curve vs. frequency is shown in Figure below. AV and Φ vs. Frequency plot To help predict the closed loop phase shift from input to output, we can use the open loop gain and phase curve. Since the circuit configuration calls for a closed loop gain, or 1/β, of ≅50 dB, the closed loop gain curve intersects the open loop gain curve at approximately 22 kHz. After this intersection, the closed loop gain curve rolls off at the typical 20 dB/decade for voltage feedback amplifiers, and follows the open loop gain curve. What is actually at work here is the negative feedback from the closed loop modifies the open loop response. Closing the loop with negative feedback establishes a closed loop pole at 22 kHz. Much like the dominant pole in the open loop phase curve, we will expect phase shift in the closed loop response. How much phase shift will we see? Since the new pole is now at 22 kHz, this is also the -3 dB point as the pole starts to roll off the closed loop again at 20 dB per decade as stated earlier. As with any pole in basic control theory, phase shift starts to occur one decade in frequency before the pole, and ends at 90o of phase shift one decade in frequency after the pole. So what does this predict for the closed loop response in our circuit? This will predict phase shift starting at 2.2 kHz, with 45o of phase shift at the -3 dB point of 22 kHz, and finally ending with 90o of phase shift at 220 kHz. The three Figures shown below are oscilloscope captures at the frequencies of interest for our OPA227 circuit. Figure below is set for 2.2 kHz, and no noticeable phase shift is present. Figure below is set for 220 kHz, and ≅45o of phase shift is recorded. Finally, Figure below is set for 220 MHz, and the expected ≅90o of phase shift is recorded. The scope plots were captured using a LeCroy 44x Wavesurfer. The final scope plot used a x1 probe with the trigger set to HF reject. OPA227 Av=50dB @ 2.2 kHz OPA227 Av=50dB @ 22 kHz OPA227 Av=50dB @ 220 kHz
|
|
| Home Semiconductors Operational Amplifiers Input to Output Phase Shift |
|
Last Update: 2010-11-19