 You are working with the text-only light edition of "H.Lohninger: Teach/Me Data Analysis, Springer-Verlag, Berlin-New York-Tokyo, 1999. ISBN 3-540-14743-8". Click here for further information.
| You are working with the text-only light edition of "H.Lohninger: Teach/Me Data Analysis, Springer-Verlag, Berlin-New York-Tokyo, 1999. ISBN 3-540-14743-8". Click here for further information.
|
| See also: autocorrelation function, scatter plot |   |
Autocorrelation can easily be shown when one tries to plot the original value against a time-shifted copy of it. Look, for example, at the population of rabbits. The population shows a regular fluctuation within a period of 10 years.
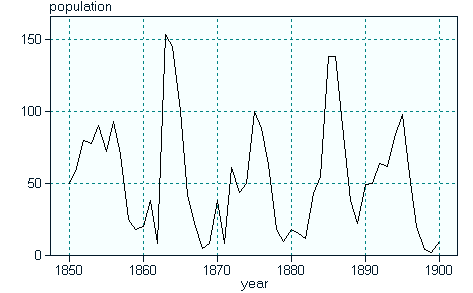
Plotting the rabbit data against itself with no time shift, of course results in a correlation coefficient of 1.0. A time shift of one year already produces a considerably lower correlation coefficient of 0.63.
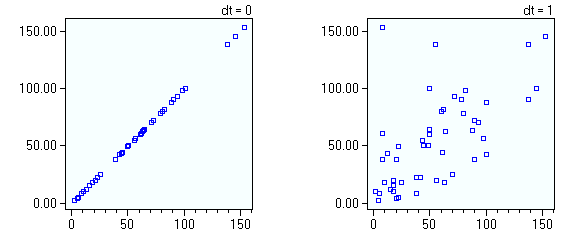
You should take a closer look at the relationship between the autocorrelation
function and the scatter plots by starting the ![]() .
.
Last Update: 2004-Jul-03