 You are working with the text-only light edition of "H.Lohninger: Teach/Me Data Analysis, Springer-Verlag, Berlin-New York-Tokyo, 1999. ISBN 3-540-14743-8". Click here for further information.
| You are working with the text-only light edition of "H.Lohninger: Teach/Me Data Analysis, Springer-Verlag, Berlin-New York-Tokyo, 1999. ISBN 3-540-14743-8". Click here for further information.
|
Table of Contents  Introductory Stuff Definition of basic terms Data Matrices Introductory Stuff Definition of basic terms Data Matrices |
|
| See also: matrix algebra, missing values |   |
When you are measuring data in your lab, you finally have a data matrix
which contains a certain number of rows and columns. The data is usually
arranged in such a way, that each row of the data matrix contains all measurements
on a single data object. The rows therefore represent the objects,
or samples, whereas the columns represent the
variables,
or descriptors. ![]()
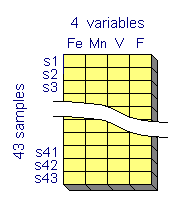
Example: Suppose you are an analytical chemist who is doing research on volcanic rocks sampled from Mt. Vesuvius near Naples, Italy. The rock samples collected from 43 sites at and around Mt. Vesuvius are analyzed for their iron, manganese, vanadium and fluorine content. The results are compiled in a data matrix with 43 rows and 4 columns:
Last Update: 2006-Jän-17