 You are working with the text-only light edition of "H.Lohninger: Teach/Me Data Analysis, Springer-Verlag, Berlin-New York-Tokyo, 1999. ISBN 3-540-14743-8". Click here for further information.
| You are working with the text-only light edition of "H.Lohninger: Teach/Me Data Analysis, Springer-Verlag, Berlin-New York-Tokyo, 1999. ISBN 3-540-14743-8". Click here for further information.
|
| See also: samples, population |   |
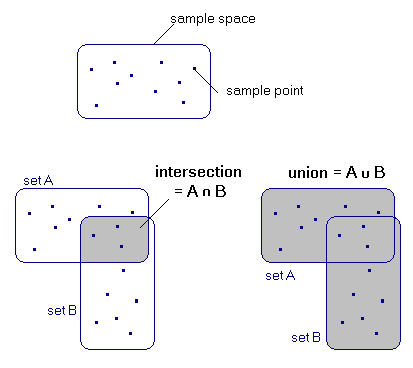
Venn diagrams are a simple but effective method of visualizing the sample
space and its individual events. Furthermore Venn diagrams can be used
to display set operations such as unions, or intersections.
Last Update: 2004-Jul-03