 You are working with the text-only light edition of "H.Lohninger: Teach/Me Data Analysis, Springer-Verlag, Berlin-New York-Tokyo, 1999. ISBN 3-540-14743-8". Click here for further information.
| You are working with the text-only light edition of "H.Lohninger: Teach/Me Data Analysis, Springer-Verlag, Berlin-New York-Tokyo, 1999. ISBN 3-540-14743-8". Click here for further information.
|
Table of Contents  Appendix Exercises Boiling Points and Chemical Structure Appendix Exercises Boiling Points and Chemical Structure |
|
| See also: MLR, variable selection |   |
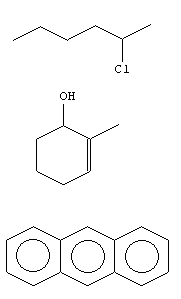 Chemical
structures can be described in many different ways. One particular way
is quite useful for setting up quantitative structure property relationships
(QSPR). For each chemical structure investigated, a lot of numerical descriptors
are calculated. These descriptors may define simple things, like the number
of carbon atoms in the structure, or more sophisticated things, such as
descriptors derived from graph-theoretical calculations. After calculating
these descriptors, you end up with a matrix containing these numbers and
a vector with the chemical/physical property of being investigated (e.g.
the boiling point). You can then try to find a suitable set of variables
and set up a multivariate regression model.
Chemical
structures can be described in many different ways. One particular way
is quite useful for setting up quantitative structure property relationships
(QSPR). For each chemical structure investigated, a lot of numerical descriptors
are calculated. These descriptors may define simple things, like the number
of carbon atoms in the structure, or more sophisticated things, such as
descriptors derived from graph-theoretical calculations. After calculating
these descriptors, you end up with a matrix containing these numbers and
a vector with the chemical/physical property of being investigated (e.g.
the boiling point). You can then try to find a suitable set of variables
and set up a multivariate regression model.
Use the data set BOILPTS and
go to the ![]() to model the boiling point from the given structural descriptors. Try to
combine different descriptors to find an optimum combination (just a hint:
the model should result in a standard deviation of the residuals of below
8.0, a quality of fit of about 0.97, and a F-statistic of about 2300).
Try to answer the following questions:
to model the boiling point from the given structural descriptors. Try to
combine different descriptors to find an optimum combination (just a hint:
the model should result in a standard deviation of the residuals of below
8.0, a quality of fit of about 0.97, and a F-statistic of about 2300).
Try to answer the following questions:
Last Update: 2005-Jul-16