| General Chemistry is a free introductory textbook on chemistry. See the editorial for more information.... |
|
Home  Physical Chemistry Phase Equilibrium and Intermolecular Interactions Phase Diagrams Physical Chemistry Phase Equilibrium and Intermolecular Interactions Phase Diagrams |
|||||||
| See also: Condensation and Freezing | |||||||


|
  |
||||||
Phase DiagramsAuthor: John Hutchinson
Since the boiling point is the temperature at which the applied pressure equals the vapor pressure, then we can view figure 5 in a different way. Consider the specific case of water, with vapor pressure given here. To find the boiling point temperature at 1 atm pressure, we need to find the temperature at which the vapor pressure is 1 atm. To do so, we find the point on the graph where the vapor pressure is 1 atm and read off the corresponding temperature, which must be the boiling point. This will work at any given pressure. Viewed this way, for water figure 6 gives us both the vapor pressure as a function of the temperature and the boiling point temperature as a function of the pressure. They are the same graph.
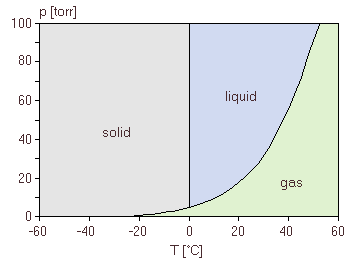
Recall that, at the boiling point, we observe that both liquid and gas are at equilibrium with one another. This is true at every combination of applied pressure and boiling point temperature. Therefore, for every combination of temperature and pressure on the graph in figure 6, we observe liquid-gas equilibrium. What happens at temperature/pressure combinations which are not on the line in figure 6? To find out, we first start at a temperature-pressure combination on the graph and elevate the temperature. The vapor pressure of the liquid rises, and if the applied pressure does not also increase, then the vapor pressure will be greater than the applied pressure. We must therefore not be at equilibrium anymore. All of the liquid vaporizes, and there is only gas in the container. Conversely, if we start at a point on the graph and lower the temperature, the vapor pressure is below the applied pressure, and we observe that all of the gas condenses into the liquid. Now, what if we start at a temperature-pressure combination on the graph and elevate the applied pressure without raising the temperature? The applied pressure will be greater than the vapor pressure, and all of the gas will condense into the liquid. figure 6 thus actually reveals to us what phase or phases are present at each combination of temperature and pressure: along the line, liquid and gas are in equilibrium; above the line, only liquid is present; below the line, only gas is present. When we label the graph with the phase or phases present in each region as in figure 6, we refer to the graph as a phase diagram. Of course, figure 6 only includes liquid, gas, and liquid-gas equilibrium. We know that, if the temperature is low enough, we expect that the water will freeze into solid. To complete the phase diagram, we need additional observations. We go back to our apparatus in figure 4 and we establish liquid-gas water phase equilibrium at a temperature of 25 °C and 23.8 torr. If we slowly lower the temperature, the vapor pressure decreases slowly as well, as shown in figure 6. If we continue to lower the temperature, though, we observe an interesting transition, as shown in the more detailed figure 7. The very smooth variation in the vapor pressure shows a slight, almost unnoticeable break very near to 0 °C. Below this temperature, the pressure continues to vary smoothly, but along a slightly different curve.
To understand what we have observed, we examine the contents of the container. We find that, at temperatures below 0 °C, the water in the container is now an equilibrium mixture of water vapor and solid water (ice), and there is no liquid present. The direct transition from solid to gas, without liquid, is called sublimation. For pressure-temperature combinations along this new curve below 0 °C, then, the curve shows the solid-gas equilibrium conditions. As before, we can interpret this two ways. The solid-gas curve gives the vapor pressure of the solid water as a function of temperature, and also gives the sublimation temperature as a function of applied pressure. figure 7 is still not a complete phase diagram, because we have not included the combinations of temperature and pressure at which solid and liquid are at equilibrium. As a starting point for these observations, we look more carefully at the conditions near 0 °C. Very careful measurements reveal that the solid-gas line and the liquid-gas line intersect in figure 7 where the temperature is 0.01 °C. Under these conditions, we observe inside the container that solid, liquid, and gas are all three at equilibrium inside the container. As such, this unique temperature-pressure combination is called the triple point. At this point, the liquid and the solid have the same vapor pressure, so all three phases can be at equilibrium. If we raise the applied pressure slightly above the triple point, the vapor must disappear. We can observe that, by very slightly varying the temperature, the solid and liquid remain in equilibrium. We can further observe that the temperature at which the solid and liquid are in equilibrium varies almost imperceptibly as we increase the pressure. If we include the solid-liquid equilibrium conditions on the previous phase diagram, we get this, where the solid-liquid line is very nearly vertical.
Each substance has its own unique phase diagram, corresponding to the diagram in figure 8 for water.
|
|||||||
| Home Physical Chemistry Phase Equilibrium and Intermolecular Interactions Phase Diagrams |
|
||||||

Last Update: 2011-02-16