 You are working with the text-only light edition of "H.Lohninger: Teach/Me Data Analysis, Springer-Verlag, Berlin-New York-Tokyo, 1999. ISBN 3-540-14743-8". Click here for further information.
| You are working with the text-only light edition of "H.Lohninger: Teach/Me Data Analysis, Springer-Verlag, Berlin-New York-Tokyo, 1999. ISBN 3-540-14743-8". Click here for further information.
|
Table of Contents  General Processing Steps Visualization Boxplots General Processing Steps Visualization Boxplots |
|
| See also: distributions, outliers |   |
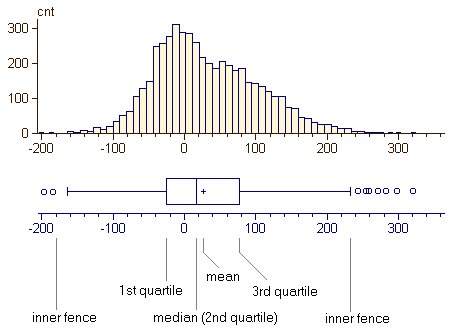
Box and whisker displays, or boxplots, summarize the most important parameters of univariate distributions. A boxplot consists of a rectangle showing the interquartile range (IQR). Within this box the median is depicted as a separating line, and the mean is a plus sign. To the left and right of the box are lines (called whiskers), which extend to the most extreme value within 1.5*IQR above or below the hinges of the box. The values at exactly 1.5*IQR from the hinges are called the inner fence. Similarly, the outer fences are defined by 3*IQR above or below the hinges (not shown in the figure below). Observations which fall within the inner and outer fences are depicted as small circles, observations outside the outer fences are marked by crosses. Please note that observations that fall outside the outer fences are extremly unlikely (probability below 0.0001).

Last Update: 2006-Jän-17