 You are working with the text-only light edition of "H.Lohninger: Teach/Me Data Analysis, Springer-Verlag, Berlin-New York-Tokyo, 1999. ISBN 3-540-14743-8". Click here for further information.
| You are working with the text-only light edition of "H.Lohninger: Teach/Me Data Analysis, Springer-Verlag, Berlin-New York-Tokyo, 1999. ISBN 3-540-14743-8". Click here for further information.
|
Table of Contents  General Processing Steps Visualization Histograms General Processing Steps Visualization Histograms |
|
| See also: Frequency Polygons, Stem-and-Leaf Plots, distribution, cumulative frequencies |   |
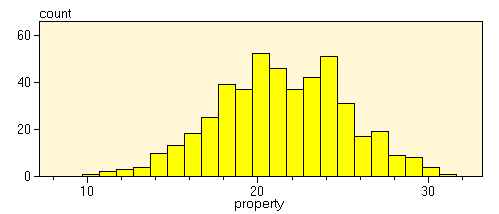
Histograms are an efficient and common method to describe distributions
of continuous variables. In general, histograms plot the frequency of occurrence
of an observation within given fixed-width intervals. Histograms can be
regarded as a type of classification of data. Each sample is sorted into
one of several "bins" according to some property. The following ![]() shows
how histograms are calculated.
shows
how histograms are calculated.
The last equation is unsuitable for a low number of observations (<50).
When constructing a histogram one should be careful to establish strict proportionality between the areas of the histogram bars and the underlying frequencies. Humans tend to interpret diagrams which do not exhibit this proportionality in a wrong and misleading way. In addition, one should avoid unequal bar widths. By using equal widths the frequencies can be directly related to the heights of the bars.
Histograms, by definition, are stair case functions. A smoother alternative to histograms can be seen in frequency polygons.
Last Update: 2006-Jän-17