| General Chemistry is a free introductory textbook on chemistry. See the editorial for more information.... |

|
Home  Physical Chemistry Reaction Equilibrium in the Gas Phase Temperature Dependence of the Reaction Equilibrium Physical Chemistry Reaction Equilibrium in the Gas Phase Temperature Dependence of the Reaction Equilibrium |
|||||||||||||||||||||||||||||


|
  |
||||||||||||||||||||||||||||
Temperature Dependence of the Reaction EquilibriumAuthor: John Hutchinson
We have previously observed that phase equilibrium, and in particular vapor pressure, depend on the temperature, but we have not yet studied the variation of reaction equilibrium with temperature. We focus our initial study on this reaction and we measure the equilibrium partial pressures at a variety of temperatures. From these measurements, we can compile the data showing the temperature dependence of the equilibrium constant Kp for this reaction in table 4.
Note that the equilibrium constant increases dramatically with temperature. As a result, at equilibrium, the pressure of HI must also increase dramatically as the temperature is increased. These data do not seem to have a simple relationship between Kp and temperature. We must appeal to arguments based on Thermodynamics, from which it is possible to show that the equilibrium constant should vary with temperature according to the following equation:
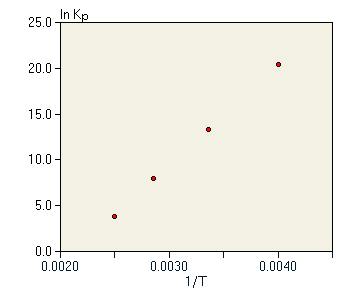
If ΔH° and ΔS° do not depend strongly on the temperature, then this equation would predict a simple straight line relationship between lnKp and 1/T. In addition, the slope of this line should be -(ΔH°/R). We test this possibility with the graph in figure 4.
In fact, we do observe a straight line through the data. In this case, the line has a negative slope. Note carefully that this means that Kp is increasing with temperature. The negative slope via equation 9 means that -(ΔH°/R) must be negative, and indeed for this reaction in this temperature range, ΔH° = 15.6kJ/mol. This value matches well with the slope of the line in figure 4. Given the validity of equation 9 in describing the temperature dependence of the equilibrium constant, we can also predict that an exothermic reaction with ΔH°<0 should have a positive slope in the graph of lnKp versus 1/T, and thus the equilibrium constant should decrease with increasing temperature. A good example of an exothermic reaction is the synthesis of ammonia for which ΔH° = -99.2 kJ/mol. Equilibrium constant data are given in table 5. Note that, as predicted, the equilibrium constant for this exothermic reaction decreases rapidly with increasing temperature. The data from table 5 is shown in figure 5, clearly showing the contrast between the endothermic reaction and the exothermic reaction. The slope of the graph is positive for the exothermic reaction and negative for the endothermic reaction. From equation 9, this is a general result for all reactions.
|
|||||||||||||||||||||||||||||
| Home Physical Chemistry Reaction Equilibrium in the Gas Phase Temperature Dependence of the Reaction Equilibrium |
|
||||||||||||||||||||||||||||

Last Update: 2011-02-20