| General Chemistry is a free introductory textbook on chemistry. See the editorial for more information.... |

|
Home  Physical Chemistry Reaction Rates Oxidized Buckminsterfullerene Physical Chemistry Reaction Rates Oxidized Buckminsterfullerene |
|||||||||||||||||||||||||||||||||||||||||||||||||||||||||||||||||||||||||||||||||||||||||||||||||||||||


|
  |
||||||||||||||||||||||||||||||||||||||||||||||||||||||||||||||||||||||||||||||||||||||||||||||||||||||
Oxidized BuckminsterfullereneAuthor: John Hutchinson
We begin by considering a fairly simple reaction on a rather elegant molecule. One oxidized form of buckminsterfullerene C60 is C60O3, with a three oxygen bridge as shown in figure 1.
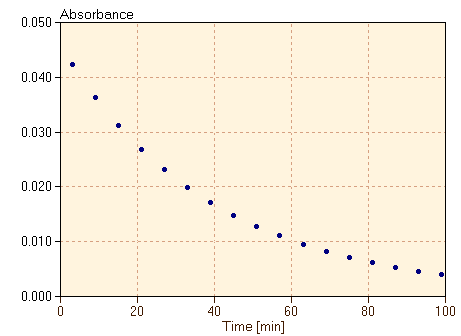
C60O3 is prepared from C60 dissolved in toluene solution at temperatures of 0°C or below. When the solution is warmed, C60O3 decomposes, releasing O2 and creating C60O in a reaction which goes essentially to completion. We can actually watch this process happen in time by measuring the amount of light of a specific frequency absorbed by the C60O3 molecules, called the absorbance. The absorbance is proportional to the concentration of the C60O3 in the toluene solution, so observing the absorbance as a function of time is essentially the same as observing the concentration as a function of time. One such set of data is given in table 1, and is shown in the graph in figure 2.
The rate at which the decomposition reaction is occurring is clearly related to the rate of change of the concentration [C60O3], which is proportional to the slope of the graph in figure 2. Therefore, we define the rate of this reaction as
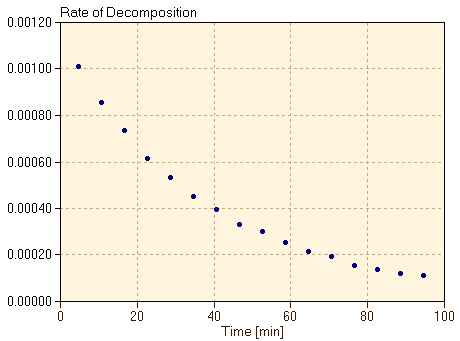
We want the rate of reaction to be positive, since the reaction is proceeding forward. However, because we are measuring the rate of disappearance of the reactant in this case, that rate is negative. We include a negative sign in this definition of rate so that the rate in equation 1 is a positive number. Note also that the slope of the graph in figure 2 should be taken as the derivative of the graph, since the graph is not a straight line. We will approximate that derivative by estimating the slope at each time in the data, taking the change in the absorbance of the C60O3 divided by the change in time at each time step. The rate, calculated in this way, is plotted as a function of time in figure 3.
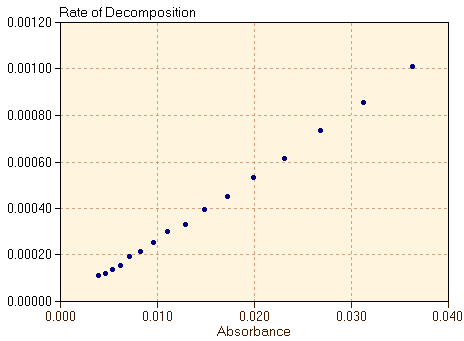
It is clear that the slope of the graph in figure 2 changes over the course of time. Correspondingly, figure 3 shows that the rate of the reaction decreases as the reaction proceeds. The reaction is at first very fast but then slows considerably as the reactant C60O3 is depleted. The shape of the graph for rate versus time (figure 3) is very similar to the shape of the graph for concentration versus time (figure 2). This suggests that the rate of the reaction is related to the concentration of C60O3 at each time. Therefore, in figure 4, we plot the rate of the reaction, defined in equation 1 and shown in figure 3, versus the absorbance of the C60O3.
We find that there is a very simple proportional relationship between the rate of the reaction and the concentration of the reactant. Therefore, we can write
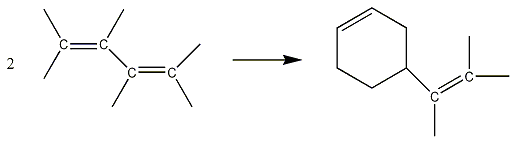
where k is a proportionality constant. This equation shows that, early in the reaction when [C60O3] is large, the reaction proceeds rapidly, and that as C60O3 is consumed, the reaction slows down. equation 2 is an example of a rate law, expressing the relationship between the rate of a reaction and the concentrations of the reactant or reactants. Rate laws are expressions of the relationship between experimentally observed rates and concentrations. As a second example of a reaction rate, we consider the dimerization reaction of butadiene gas, CH2=CH-CH=CH2. Two butadiene molecules can combine to form vinylcyclohexene, shown in figure 5.
The following table provides experimental data on the gas phase concentration of butadiene [C4H6] as a function of time at T=250°C.
We can estimate the rate of reaction at each time step as in equation 1, and these data are presented in table 2 as well. Again we see that the rate of reaction decreases as the concentration of butadiene decreases. This suggests that the rate is given by an expression like equation 2. To test this, we calculate Rate/[C4H6] in table 2 for each time step. We note that this is not a constant, so equation 2 does not describe the relationship between the rate of reaction and the concentration of butadiene. Instead we calculate Rate/[C4H6]2 in table 2. We discover that this ratio is a constant throughout the reaction. Therefore, the relationship between the rate of the reaction and the concentration of the reactant in this case is given by
which is the rate law for the reaction in figure 5. This is a very interesting result when compared to equation 2. In both cases, the results demonstrate that the rate of reaction depends on the concentration of the reactant. However, we now also know that the way in which the rate varies with the concentration depends on what the reaction is. Each reaction has its own rate law, observed experimentally.
|
|||||||||||||||||||||||||||||||||||||||||||||||||||||||||||||||||||||||||||||||||||||||||||||||||||||||
| Home Physical Chemistry Reaction Rates Oxidized Buckminsterfullerene |
|
||||||||||||||||||||||||||||||||||||||||||||||||||||||||||||||||||||||||||||||||||||||||||||||||||||||

Last Update: 2011-02-20